Evidence & Intelligence
We transform complex data into actionable insights enabling organizations to adapt to challenges, improve performance, and drive sustainable impact. Our work goes beyond traditional measurement and monitoring to help our clients and partners understand what works and what doesn’t, adapt quickly, and make smarter decisions. By conducting rigorous analysis and making evidence accessible and relevant, we empower stakeholders to maximize their impact while addressing root causes and driving systemic change.
We conduct comprehensive evaluations that uncover what’s working, what isn’t, and why, empowering organizations to learn and adapt.
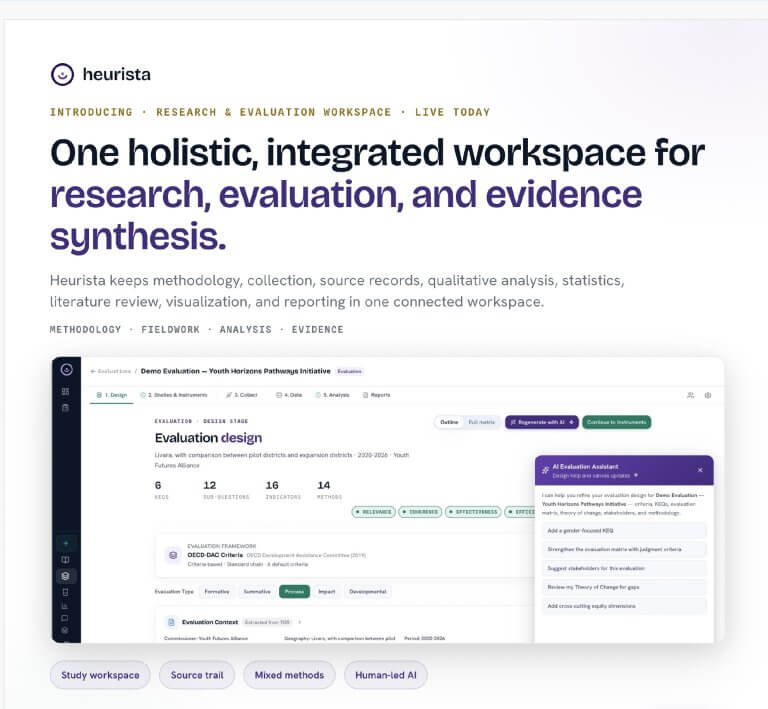
Our real-time feedback loops and predictive analytics deliver actionable insights that guide smarter, faster decision-making.
We provide tailored research and assessments that align goals with measurable results, helping organizations lead with clarity and purpose.
Our adaptive learning systems ensure you stay responsive and agile, equipped with the tools to navigate complexity.
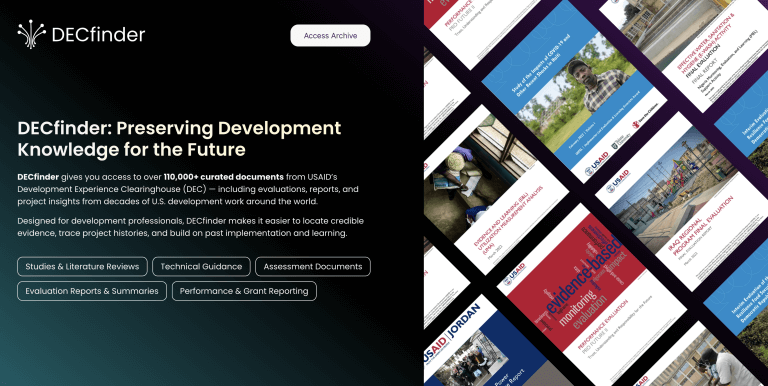
By making evidence accessible and relevant, we enable stakeholders to address root causes and drive systemic change where it matters most.
Key Services
We Offer
We bring top talent from business, development, tech, academia, and government to generate powerful evidence and intelligence. By embracing multi-disciplinary approaches, we unlock added value, insights, and efficiencies that cross industries and sectors.
Program Evaluations
Examples of Expertise
Adaptive Management & Learning Systems
Examples of Expertise
Data Analytics, Visualization, & Predictive Insights
Examples of Expertise
Mixed-Methods Research
Examples of Expertise
Real-Time Monitoring & Feedback Loops
Examples of Expertise

We Study
I4DI studies and improves the design and implementation of international development and sustainability investments. Using advanced quantitative and qualitative methodologies, we analyze complex implementation dynamics to uncover what works, what doesn’t, and why. Our rigorous research generates actionable, data-driven insights that empower decision makers to refine strategies, mitigate risks, and enhance impact. By translating evidence into practice, we drive informed policy and program decisions, fostering a sustainable future built on tested and proven approaches.
We Tailor
I4DI is dedicated to crafting tailored solutions that meet the unique needs of our clients and partners. We recognize that every challenge requires a customized approach, informed by diverse perspectives and built on active stakeholder collaboration. Leveraging advanced technologies—including remote sensing, real-time analytics, and GIS data collection—we ensure precise, timely insights that drive smarter decision-making. By fostering knowledge sharing and continuous learning, we integrate cutting edge tools with localized expertise to enhance monitoring, improve sustainability outcomes, and create lasting impact.

We Enable
I4DI equips clients and partners with the agility to navigate an ever-evolving landscape head on. Through real-time, data-driven solutions, we design tools that enable precise data collection and adaptive management. Our multidisciplinary teams—comprising MERL experts, researchers, and developers—work together to tackle complex challenges with speed and accuracy. By integrating adaptive methodologies, we provide instant insights that empower organizations to swiftly respond to emerging trends, optimize decision making, and enhance resilience in an increasingly dynamic world.
Results. Evidence. Impact.
Contact Our Experts.


Explore More Practice Areas.
Global Sustainability
We design, test, and implement fit-for-purpose, adaptive solutions that address interconnected pillars of sustainability: return on investment, social impact, and environmental resilience.
Impact Technology
We build and deploy cutting-edge innovations with practical, user-focused design to manage complexity, streamline operations, improve accountability, and deliver measurable impact.
Related Projects.
Explore I4DI’s project portfolio. Across countries and sectors, I4DI increases the impact of development investments.


Related News.
Keep the pulse on the Institute. I4DI regularly shares insights from our current projects, the latest news from the development industry, our take on global trends, and updates from our teams.